30 Levels
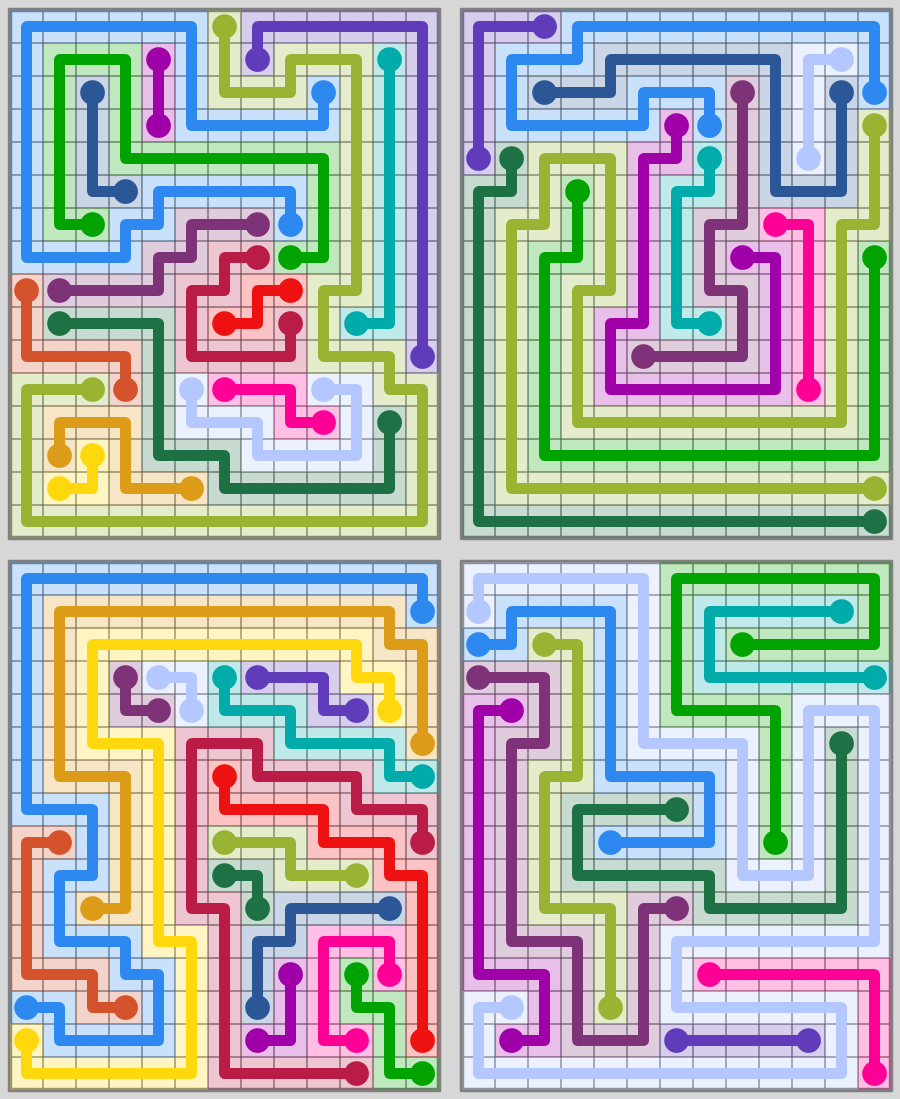
Below are images 30 levels from the Flow Free Extreme Pack and 30 levels generated and selected by my program.
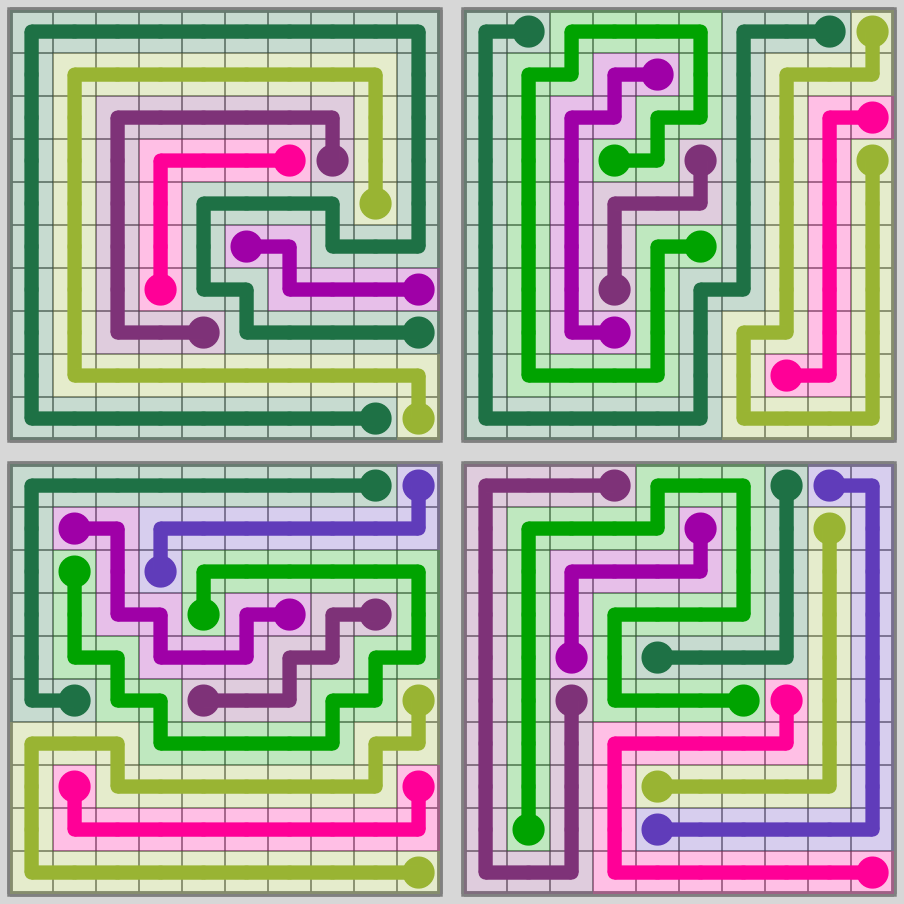
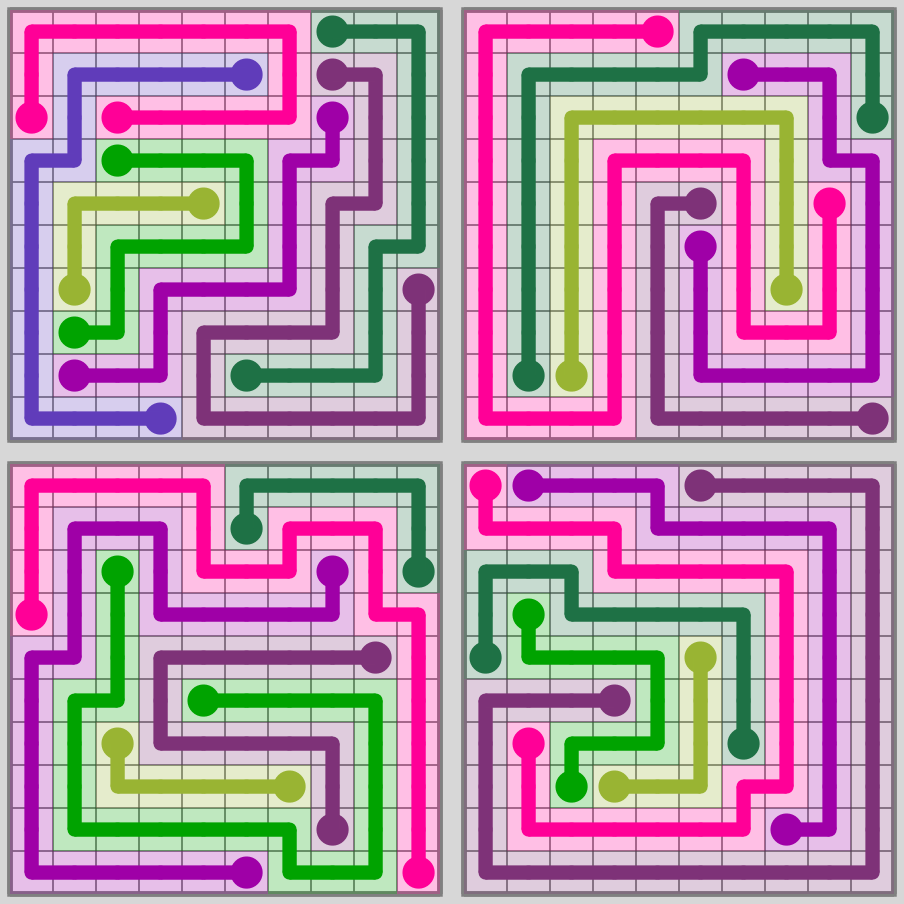
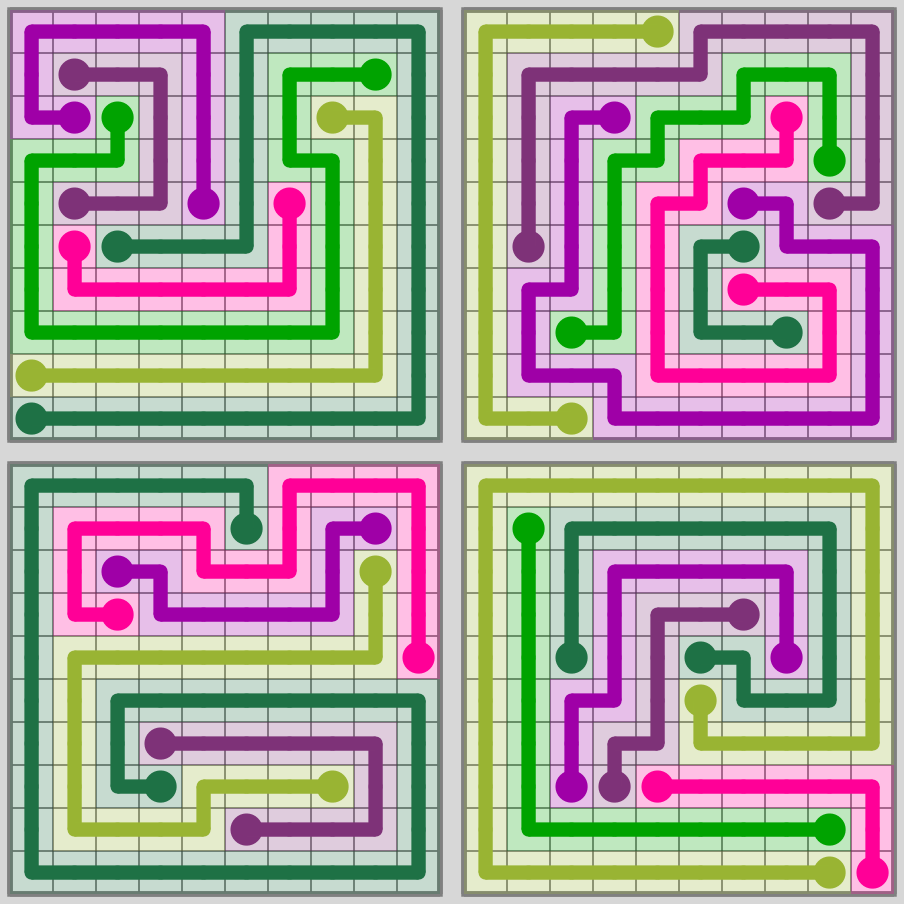


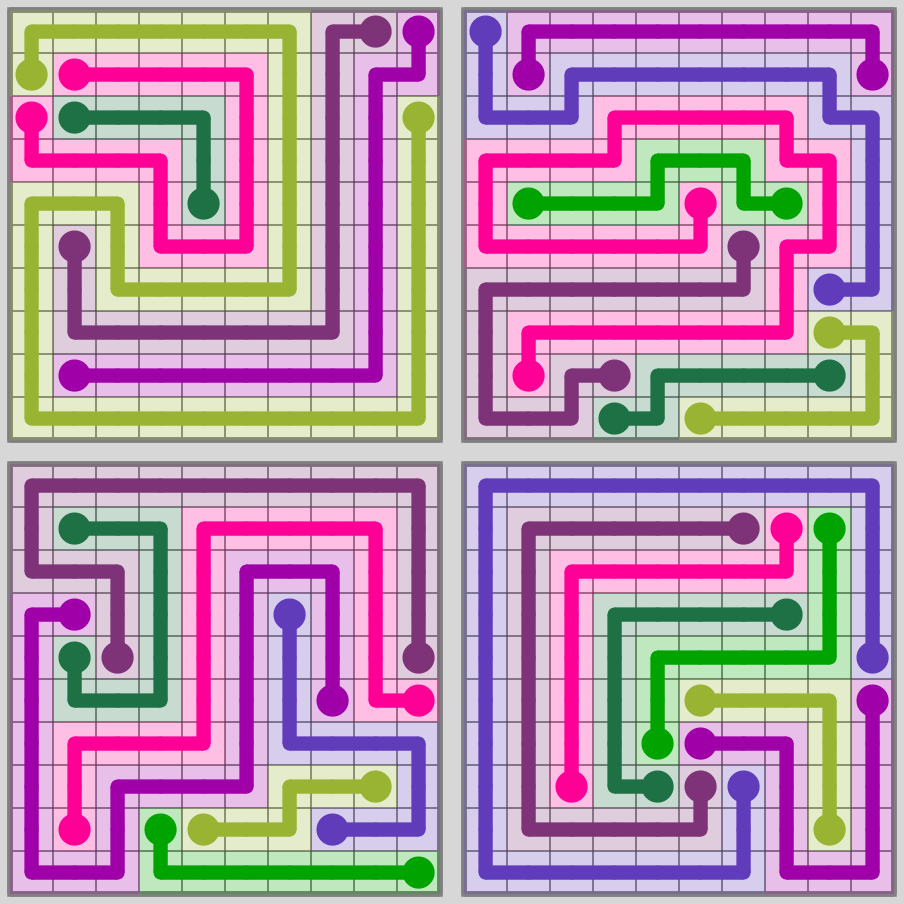
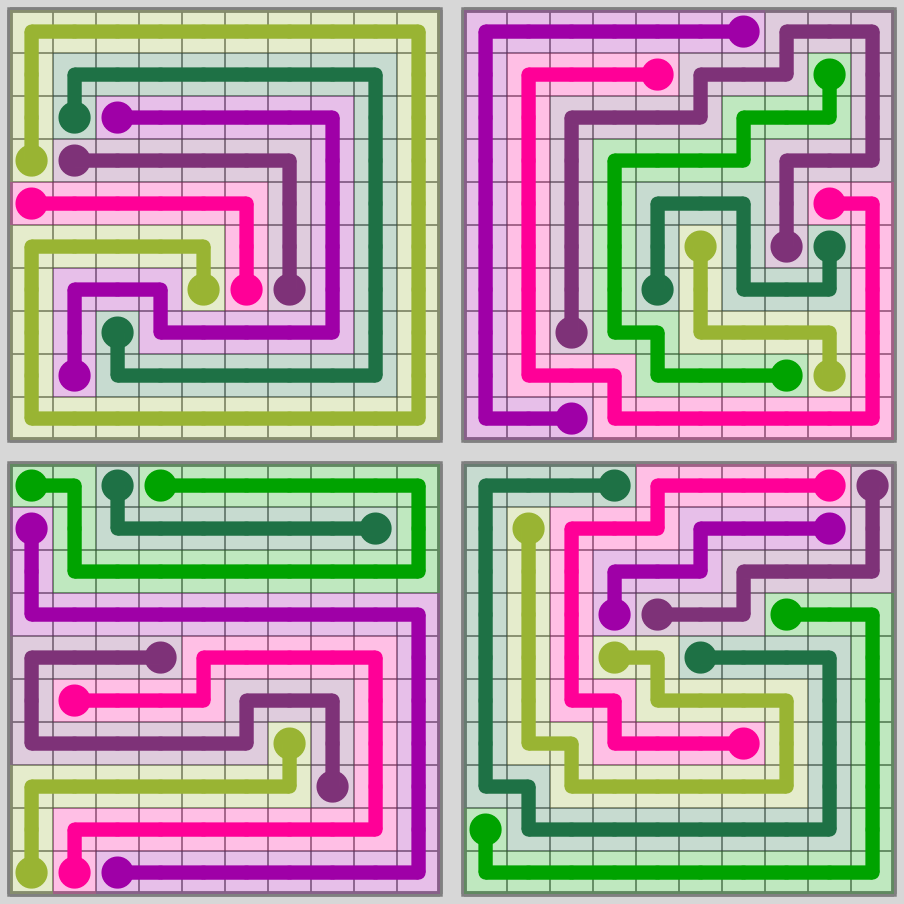
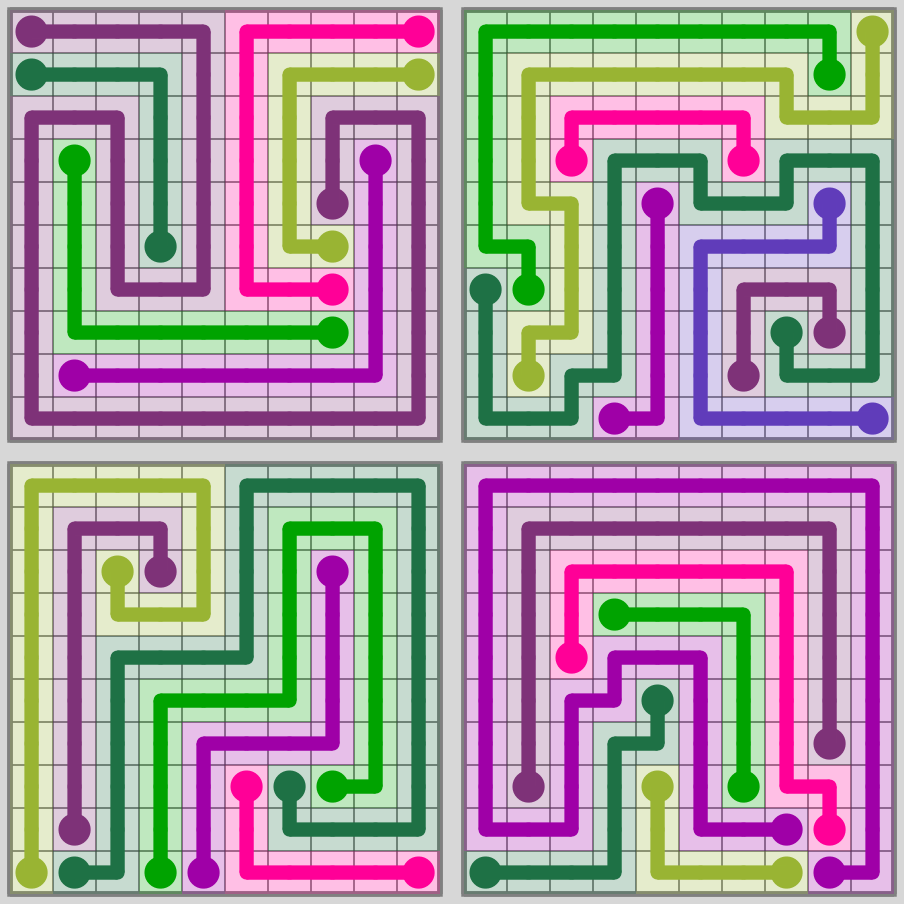
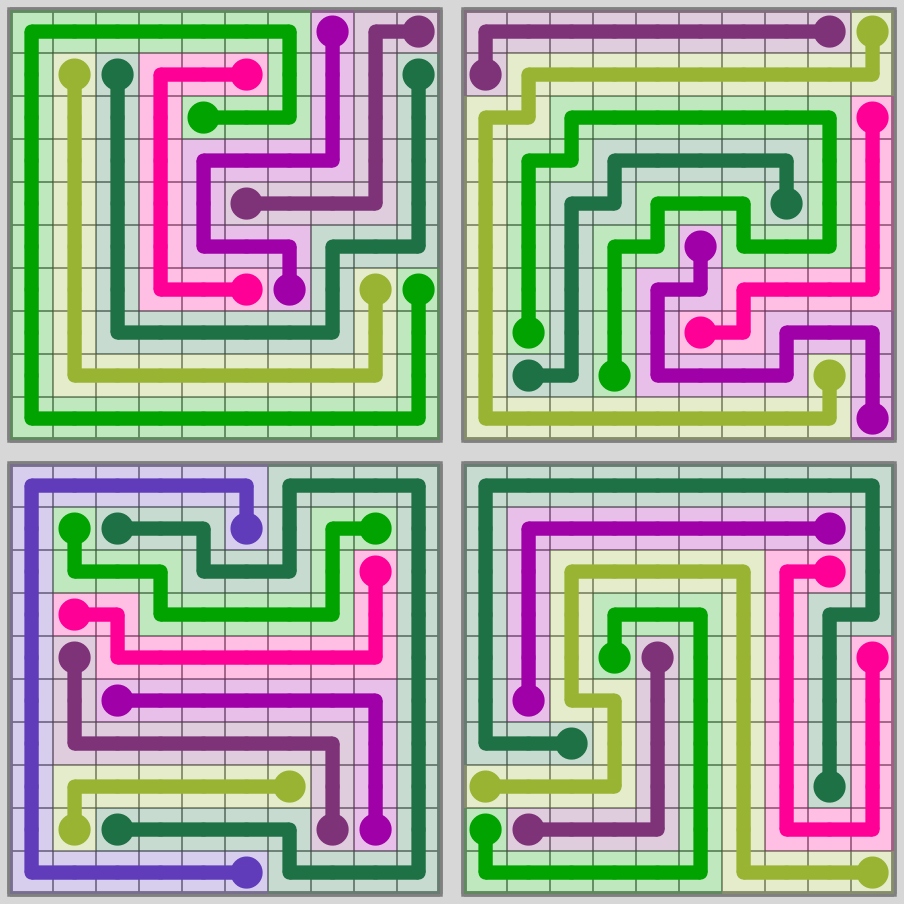
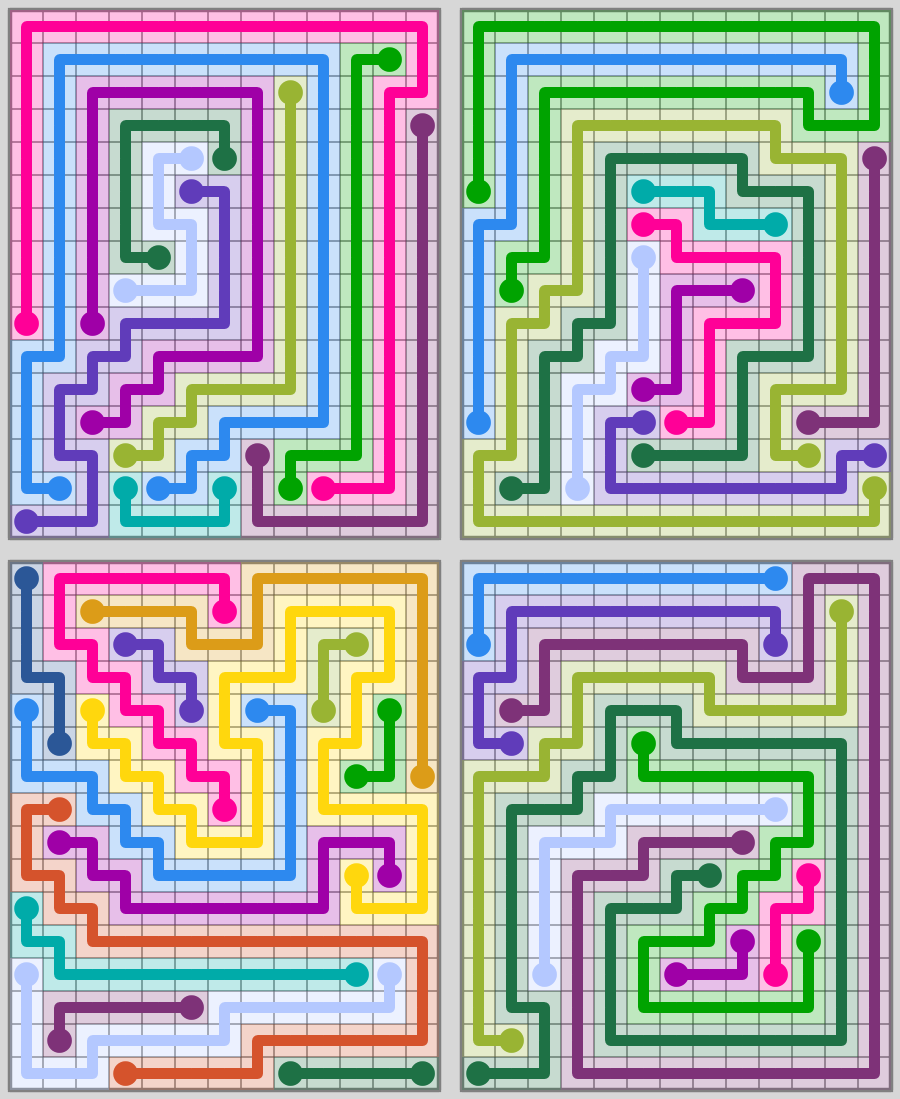
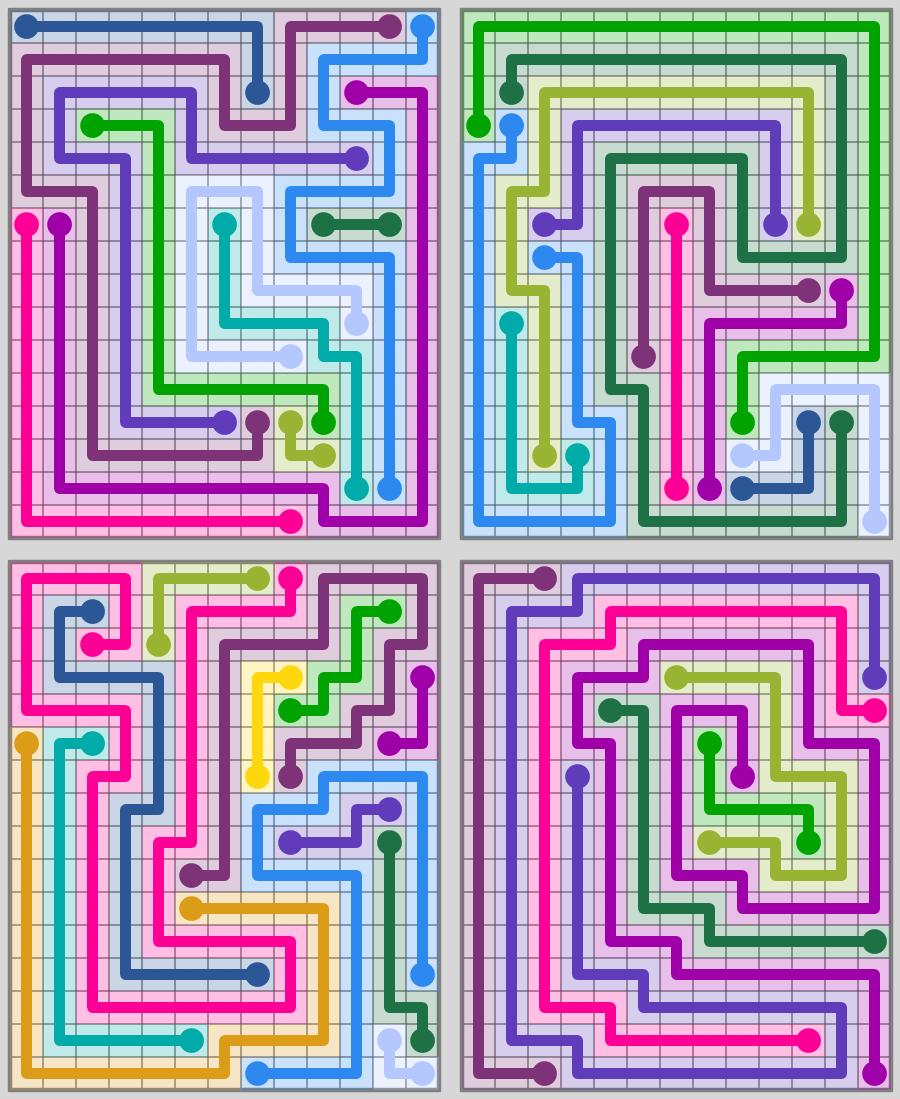
A human created half of these levels and a computer program made and selected the other half. Each quadrant is either 100% from Flow or 100% from my program. Can you tell which is which?
Flow Free
Flow Free is the game that all of my games are based off of and the benchmark I use to evaluate them.
When I released Connect Unlimited in 2016, the selling point was that it had free unlimited levels. The levels aren’t bad either – but not to the standards of Flow Free. The spiral pattern (see: The Level Generator) is far too common for one.
Prior to using them to create artwork, I used Similarity Maps and Similarity Filtering to create level packs equivalent to several of the packs in Flow Free.
Recently, I decided to convert one of the packs from Flow Free to a format my program can use to compare one against the other.
The Extreme Pack
The Extreme Pack is probably the most difficult free pack in Flow Free although there are other packs with larger board sizes. It board sizes that are 8×8 through 12×12 that are described as “tricky.”
I’m almost certain the levels in Flow Free are all created by hand – especially this pack. It’s the only pack in the game where the developers tried to make the levels more difficult without increasing the board size.
By far the most noticeable difference is that there are far fewer dots relative to the board size than all of the other packs in Flow Free. Here is a comparison with two other level packs:
| Pack | Avg Tiles | Avg Dots | Avg Line Len |
| Regular Pack | 51 | 6.15 | 8.29 |
| Jumbo Pack | 146 | 11.91 | 12.26 |
| Extreme Pack | 102 | 5.96 | 17.11 |
I chose the Extreme Pack because it is (in my opinion) the most challenging to reproduce with a computer program.
My Version
Usually I only use similarity filtering to select levels for a pack. This results in levels that are usually quite similar to those in all of the packs in Flow Free except the Extreme Pack.
Thus, I used a formula to filter down levels generated by my program before running the similarity filtering.
I tried two other methods of filtering before I settled on a third one:
- Filtering based solely on the number of dots. I wasn’t able to generate more advanced stats for the Flow version until I gave my program the solution for each level.
- A formula that counted number of dots and a few other features that I found out about the original pack after I generated the stats.
- A strict filter and nothing else: No straight lines and every line is at least 6 tiles long.
The first two versions were just fine – but I didn’t want any of my levels to be distinguishable from those in Flow Free. There are zero straight lines or lines that are less than 6 tiles long in the 10×10 Flow Free levels – so seeing either of these in a level was a giveaway that the entire quadrant was selected by my program.
The Stats
| Pack | Flow | Sim | Formula |
| Dots | 5.87 | 6.33 | 4.5 |
| Line Len | 17.05 | 15.79 | 22.22 |
| Max LL | 34 | 29.13 | 45.73 |
| Min LL | 7.83 | 7.5 | 8.07 |
| Med LL | 15.2 | 14.87 | 20.97 |
| Geo LL | 15.07 | 14.24 | 15.98 |
| Filler | 0.00 | 0 | 0 |
| Straight Lines | 0 | 0 | 0 |
| Almost Straight | 1.07 | 0.63 | 0.7 |
| Edge Lines | 0.47 | 0.2 | 0.73 |
| Almost Edge | 0.7 | 0.97 | 1.13 |
| Max Edge | 22.7 | 16.8 | 28.2 |
| Line Dir Changes | 24.28% | 32.79% | 22.71% |
| Steps | 3.48% | 8.56% | 2.50% |
The bold cells indicate which pack I think scored “best.” The red cells indicate the pack I think scored worse.
These stats are based only on the 10×10 levels. The levels for the first two columns are shown in the gallery. The “Formula” column is what a random set of levels selected from levels generated by my program meeting criteria #3.
Glossary
Dots: Average number of dots per level.
Line Len: Size of board divided by dots.
Max LL: Average line length of the longest line in each level.
Min LL: Average line length of the shortest line in each level.
Med LL: Average median line length.
Geo LL: Average geometric mean of the line lengths.
Filler: Average number of lines per level that are 4 or fewer tiles long.
Straight Lines: Average number of lines that are perfectly straight.
Almost straight: Average number of lines that are almost straight (1 direction change).
Edge Lines: Average number of lines that maintain the same distance from the edge of the board throughout.
Almost Edge: Average number of lines that maintain the same distance from the edge of the board throughout excluding the endpoints.
Max Edge: The max edge line for each level is the line that covers the most tiles at the edge of the board – there are 36 tiles around the edge of a 10×10 board. This is the average length of the max edge line for each level.
Line Changes: Percentage of time a line changes direction.
Steps: Percentage of time a line changes direction twice in a row.
The Differences:
Flow’s Extreme Pack sits in the middle of 12 out of the 14 categories – and the other two categories (Almost Straight and Almost Edge) aren’t exactly easy to spot visually.
I’ll focus on the differences between Flow Free’s Extreme pack and my version (ignoring the random set).
Dots: Flow Free’s levels have about 10% fewer dots than mine.
The other differences are mainly a result of the similarity filtering’s general preference to prefer unusual lines:
Max Edge: There are 36 tiles at the edge of the board of a 10×10 level. In Flow Free’s Extreme Pack, on average a single line covers 63% of these tiles, while my levels the number is only 47%. Similarity filtering hates lines that circle the edge of the board – the maps show lots of thick magenta shading for them.
Line Dir Changes: The lines in my levels change direction almost 33% of the time versus 24% for Flow. This is another one of the few statistics that the similarity filtering almost universally favors.
Steps: Recall that a step is two consecutive line direction changes. There are over twice as many in my levels – though since the overall number is still pretty low at 8.5% and they are mostly single steps, it’s not obvious at all from looking at the images.
Similarity Maps
The link below shows the same levels above with similarity shading.
Flow’s levels score quite well by my similarity filtering algorithm. They are about in between the random set and the levels chosen by my algorithm.
The Answer
The top left and bottom right images are from Flow Free and the other two were generated and selected by my program.
I think all of the 60 levels are at least good – and if I didn’t dive deep into the statistics it would be impossible to tell which were generated by a computer program.
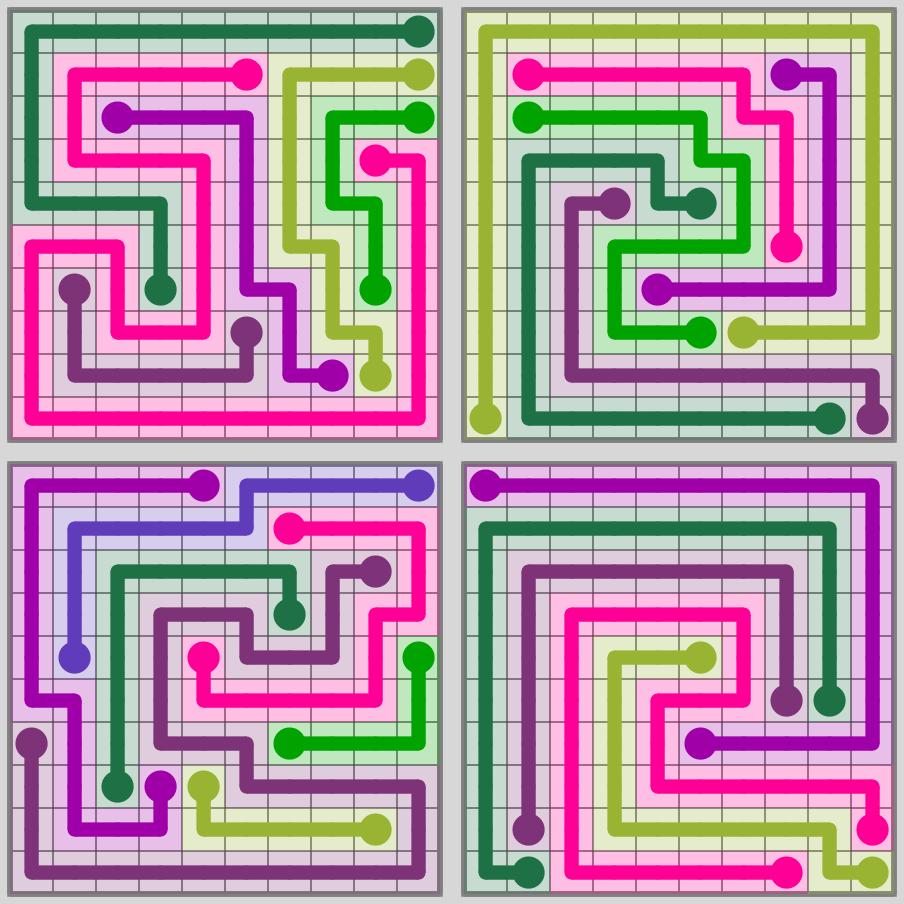
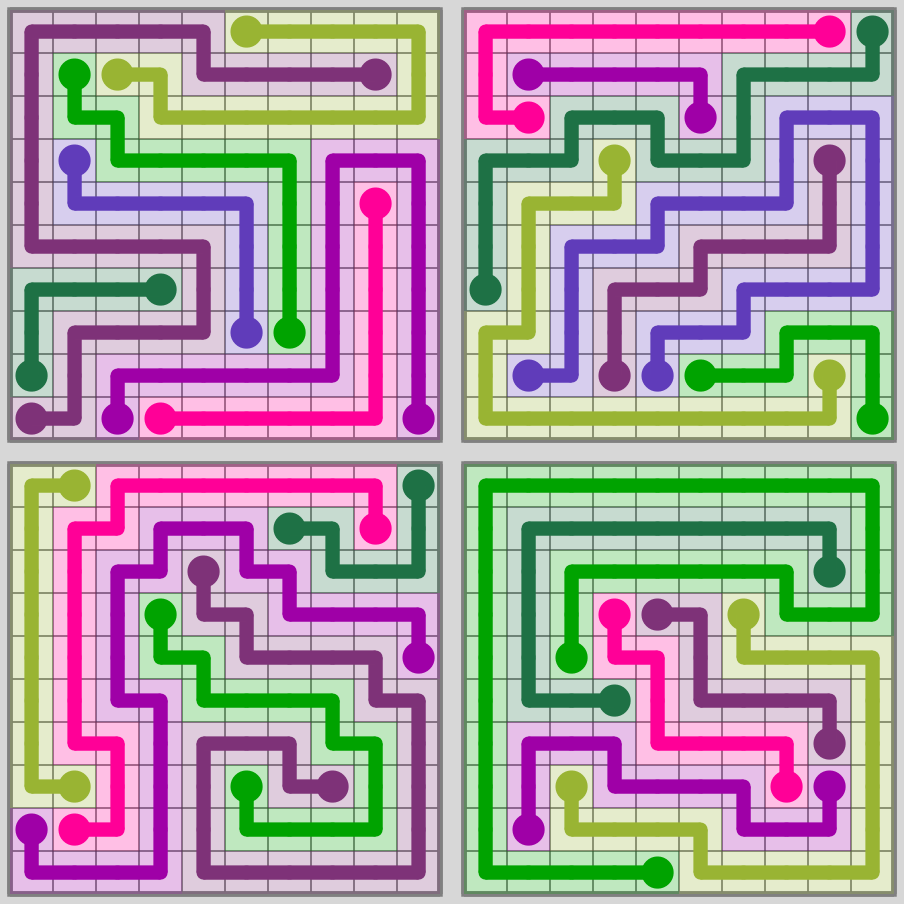
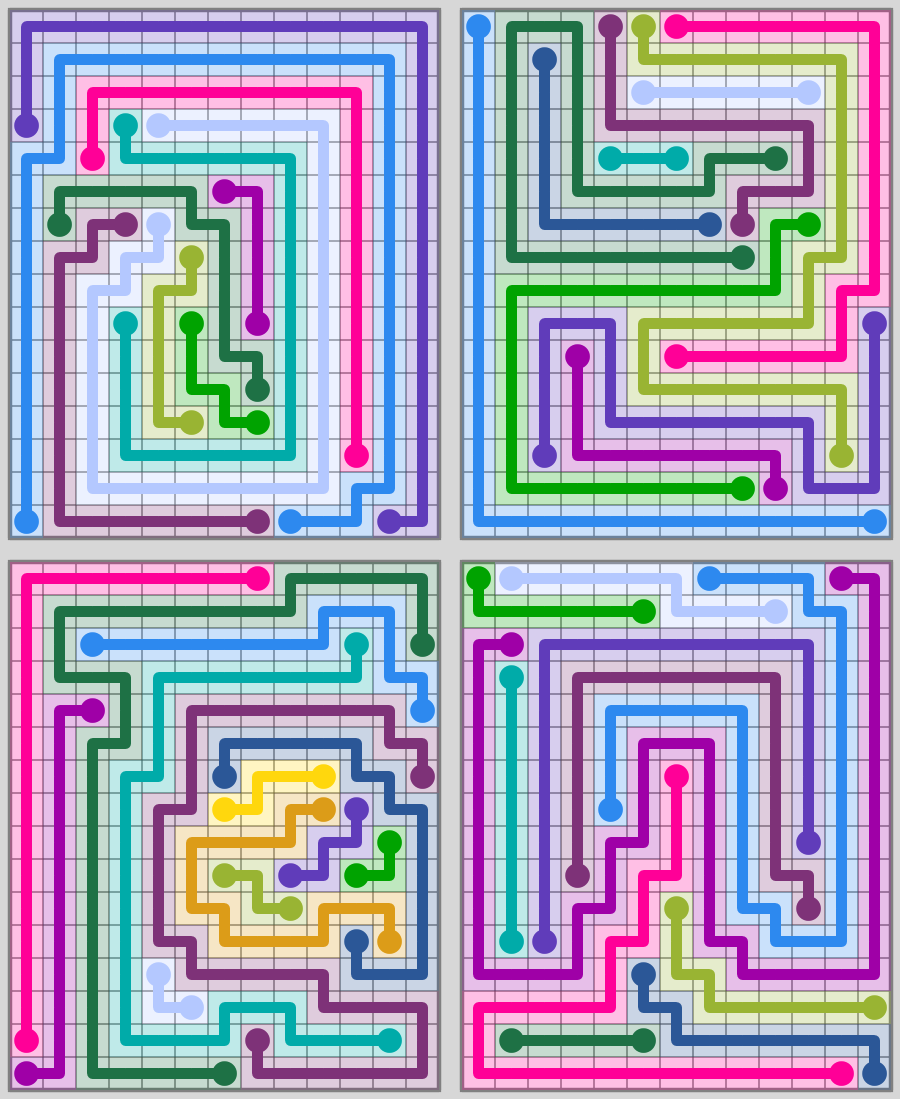
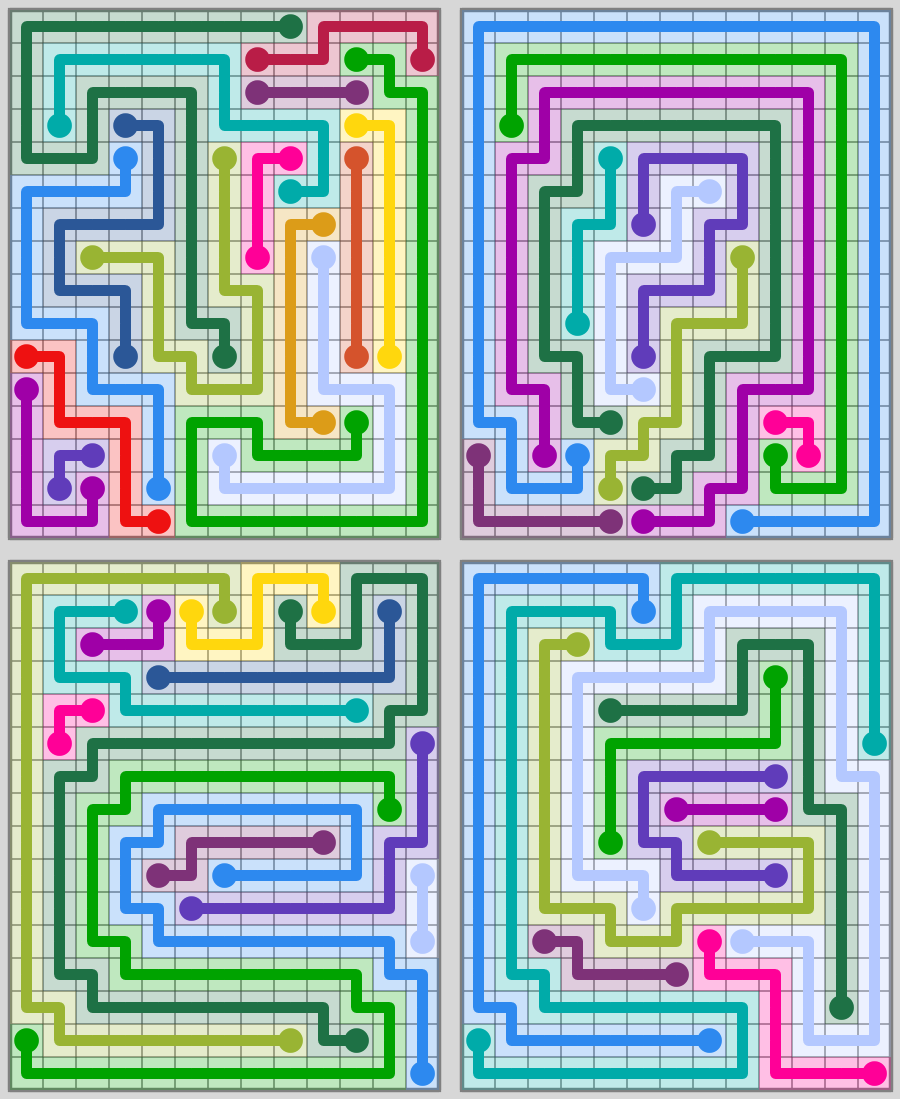
Jumbo Rectangles (16×13)
Flow Free’s Jumbo Rectangle Pack isn’t free – and I had to pay a couple dollars to get it.
The pack ranges from 14×11 to 18×15 with the height and width increasing by 1 every 30 levels. For this comparison I used the middle set of 30 levels – which are 16 tiles high by 13 tiles wide.
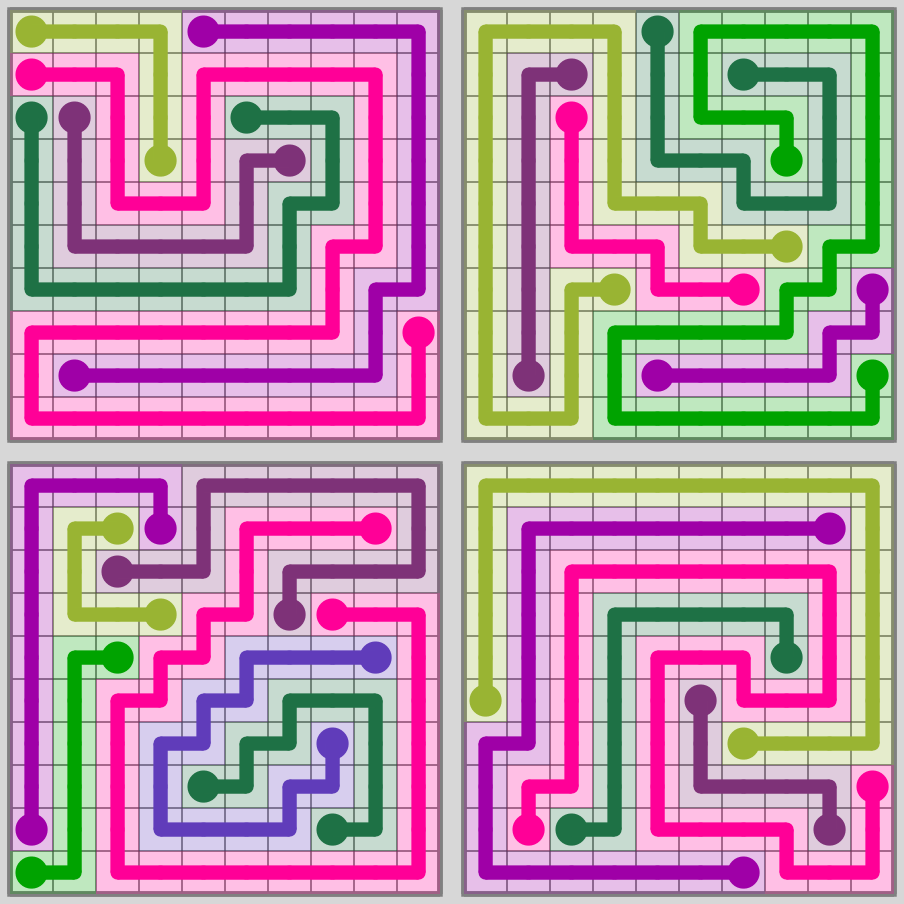
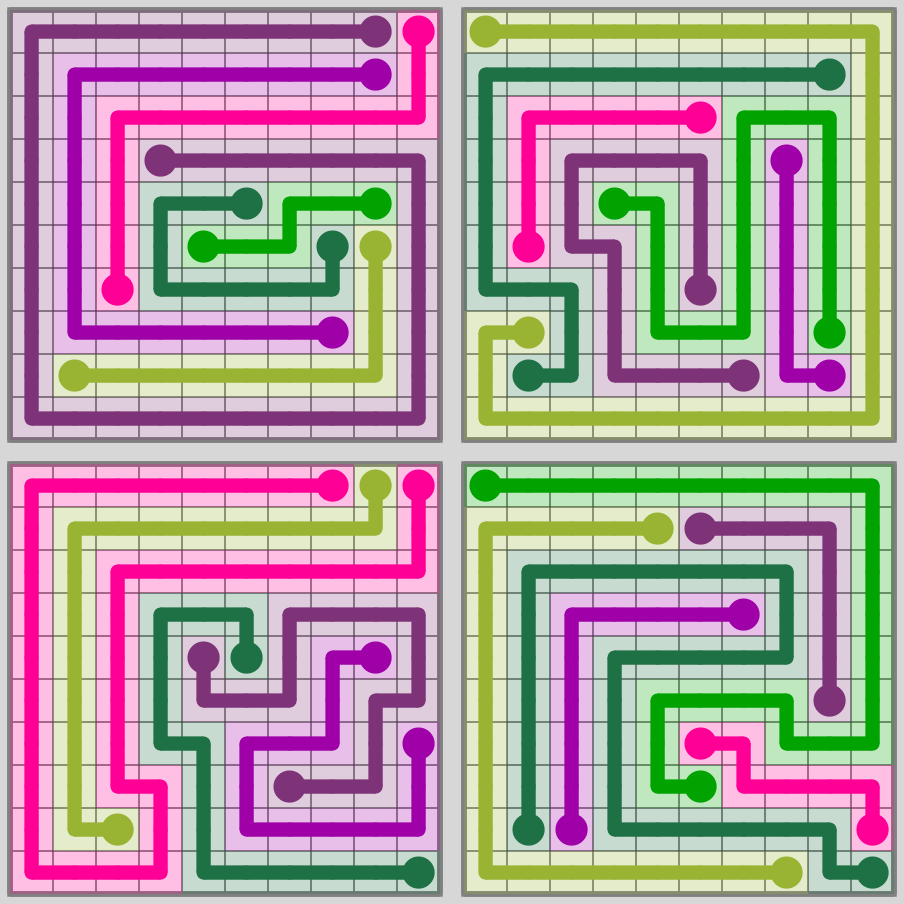
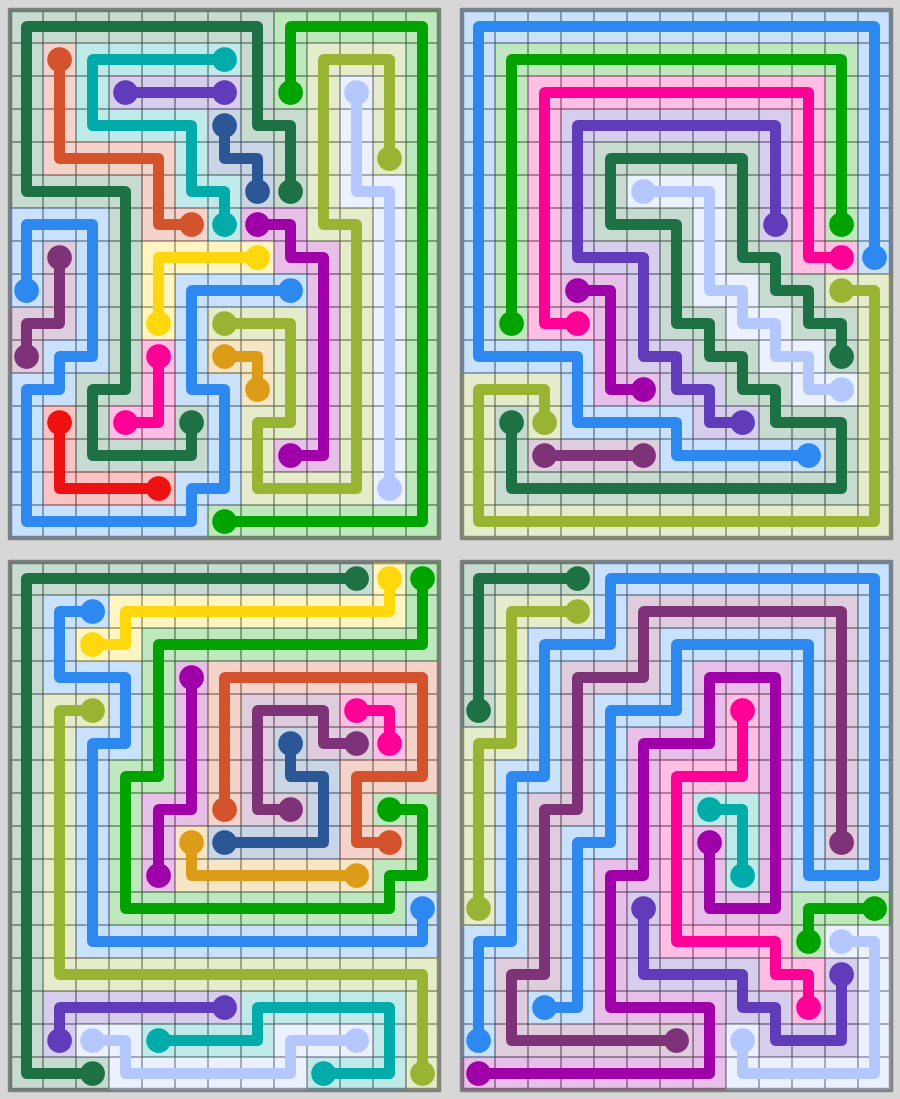
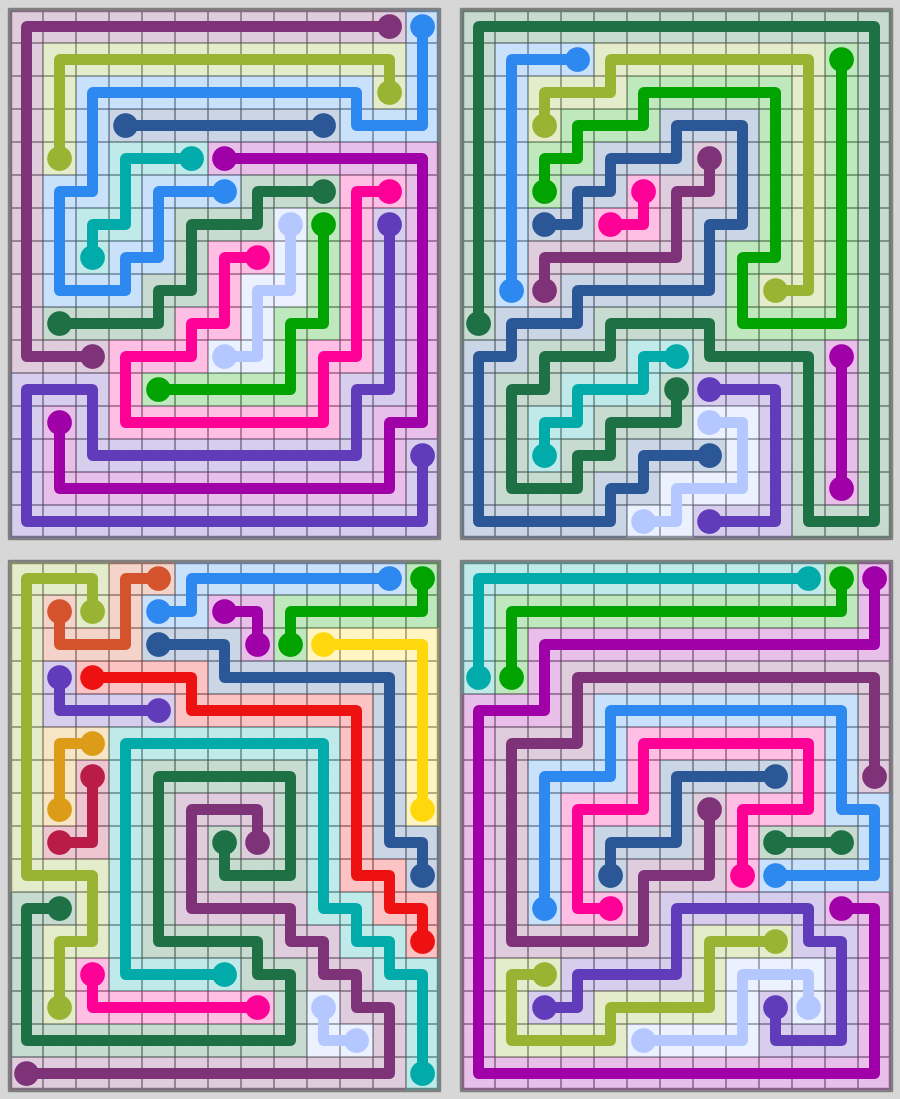
Again – two of the quadrants are from Flow Free, and two were generated and selected by my program:


The Stats (Again)
| Pack | Flow | Sim |
| Dots | 11.87 | 11.57 |
| Line Len | 17.53 | 17.98 |
| Max LL | 44.5 | 47.63 |
| Min LL | 4.07 | 3.8 |
| Med LL | 15.22 | 14.12 |
| Geo LL | 13.99 | 14.06 |
| Filler | 1.23 | 1.43 |
| Straight Lines | 0.87 | 0.47 |
| Almost Straight | 1.8 | 2.17 |
| Edge Lines | 1.27 | 0.8 |
| Almost Edge | 2.77 | 2.5 |
| Max Edge | 27.07 | 24.47 |
| Line Dir Changes | 27.64% | 30.69% |
| Steps | 7.75% | 8.83% |
The stats are very close here – with some slight edges to both packs. Of course – this is mostly by design.
First vs. Second Half
I noticed while playing Flow Free’s pack that there is a noticeable difference between the first 15 levels of each size and the last 15 levels of each size. This is backed up by the stats and mimicked by my program:
| Pack | Flow P1 | Sim P1 | Flow P2 | Sim P2 |
| Dots | 13.4 | 13.33 | 10.33 | 9.8 |
| Line Len | 15.52 | 15.6 | 20.13 | 21.22 |
| Max LL | 40 | 41.73 | 49 | 53.53 |
| Min LL | 4 | 3.13 | 4.13 | 4.47 |
| Med LL | 13.4 | 12 | 17.03 | 16.23 |
| Geo LL | 12.62 | 11.55 | 15.35 | 16.56 |
| Filler | 1.53 | 2.13 | 0.93 | 0.73 |
| Straight Lines | 0.8 | 0.33 | 0.93 | 0.6 |
| Almost Straight | 2.13 | 3.27 | 1.47 | 1.07 |
| Edge Lines | 1.4 | 0.67 | 1.13 | 0.93 |
| Almost Edge | 3.47 | 3.07 | 2.07 | 1.93 |
| Max Edge | 23.93 | 20.47 | 30.2 | 28.47 |
| Line Dir Changes | 29.03% | 33.24% | 26.30% | 28.24% |
| Steps | 8.38% | 10.67% | 7.16% | 7.09% |
The average number of dots drops by over 3 from the 1st half to the 2nd half of the levels in Flow Free. My version exceeded that by a bit. This makes the 2nd half fairly comparable to Flow Free’s Extreme Pack – except with a larger board size.
The Answer
The two quadrants on the top are from Flow Free, and the two quadrants on the bottom were generated by my program. The left quadrants are from the first half of each set and the right quadrants are from the second half.
Playing the Levels
My app tracks the time taken to solve each level as well as the number of tiles that hint mode was used. The levels generated and selected by my program took slightly longer and required more usage of hint mode than Flow Free’s levels – but the difference is hardly statistically significant. Both sets proved to be much harder than the randomly selected levels generated by my program, however.